Are consent numbers telling the whole story?
In providing free property information to kiwis, homes.co.nz collects data from each council around NZ. So when a new property is built, we hear about it. We get monthly updates on new and changing properties and can measure how many new properties enter the housing stock around the country.
We’re uniquely placed to track changes in the housing stock at the end of the build process. Our analysis considers properties after they are consented, building is completed and codes of compliance are issued.
While digging into the numbers, we’ve noticed a few interesting cases where high consent numbers do not necessarily translate to higher numbers of houses.

Differences between building consents and new housing stock on homes.co.nz
In some areas, there are large differences between the number of homes consented and those new properties entering the housing stock. These differences are focussed in areas dominated by the development of new apartments. Areas where most new properties are Residential Dwellings seem to be keeping up with the issued consents. New consents in Auckland, for example, are at a high (see latest data from Stats NZ) but the net increase in the housing stock is much less.

We don’t expect the numbers of consents and new properties to be the same due to the lag between consents being issued and properties being built. For example, properties being built now were likely consented months or years earlier! However, we would expect numbers to be roughly similar. Interestingly, this was not the case in Wellington and Auckland for several reasons.
- Empty sections are few and far between with a lot of “Brownfield Development” being required. This requires bulldozing old houses to build new ones resulting in little change to the overall number of new properties
- Potential bottlenecks relating to the building of town houses and apartments. These tend to be more complex requiring more specialised builders (who are in higher demand!) resulting in longer build times and larger lags between consents and construction.
With the sight of cranes along the Auckland skyline, it comes as no surprise that the construction of Apartments is high. However, with the overall increase in the total housing stock being less than expected, we expect strong demand for properties to continue and prices to remain steady.
Read on below for an update on property prices in your area.
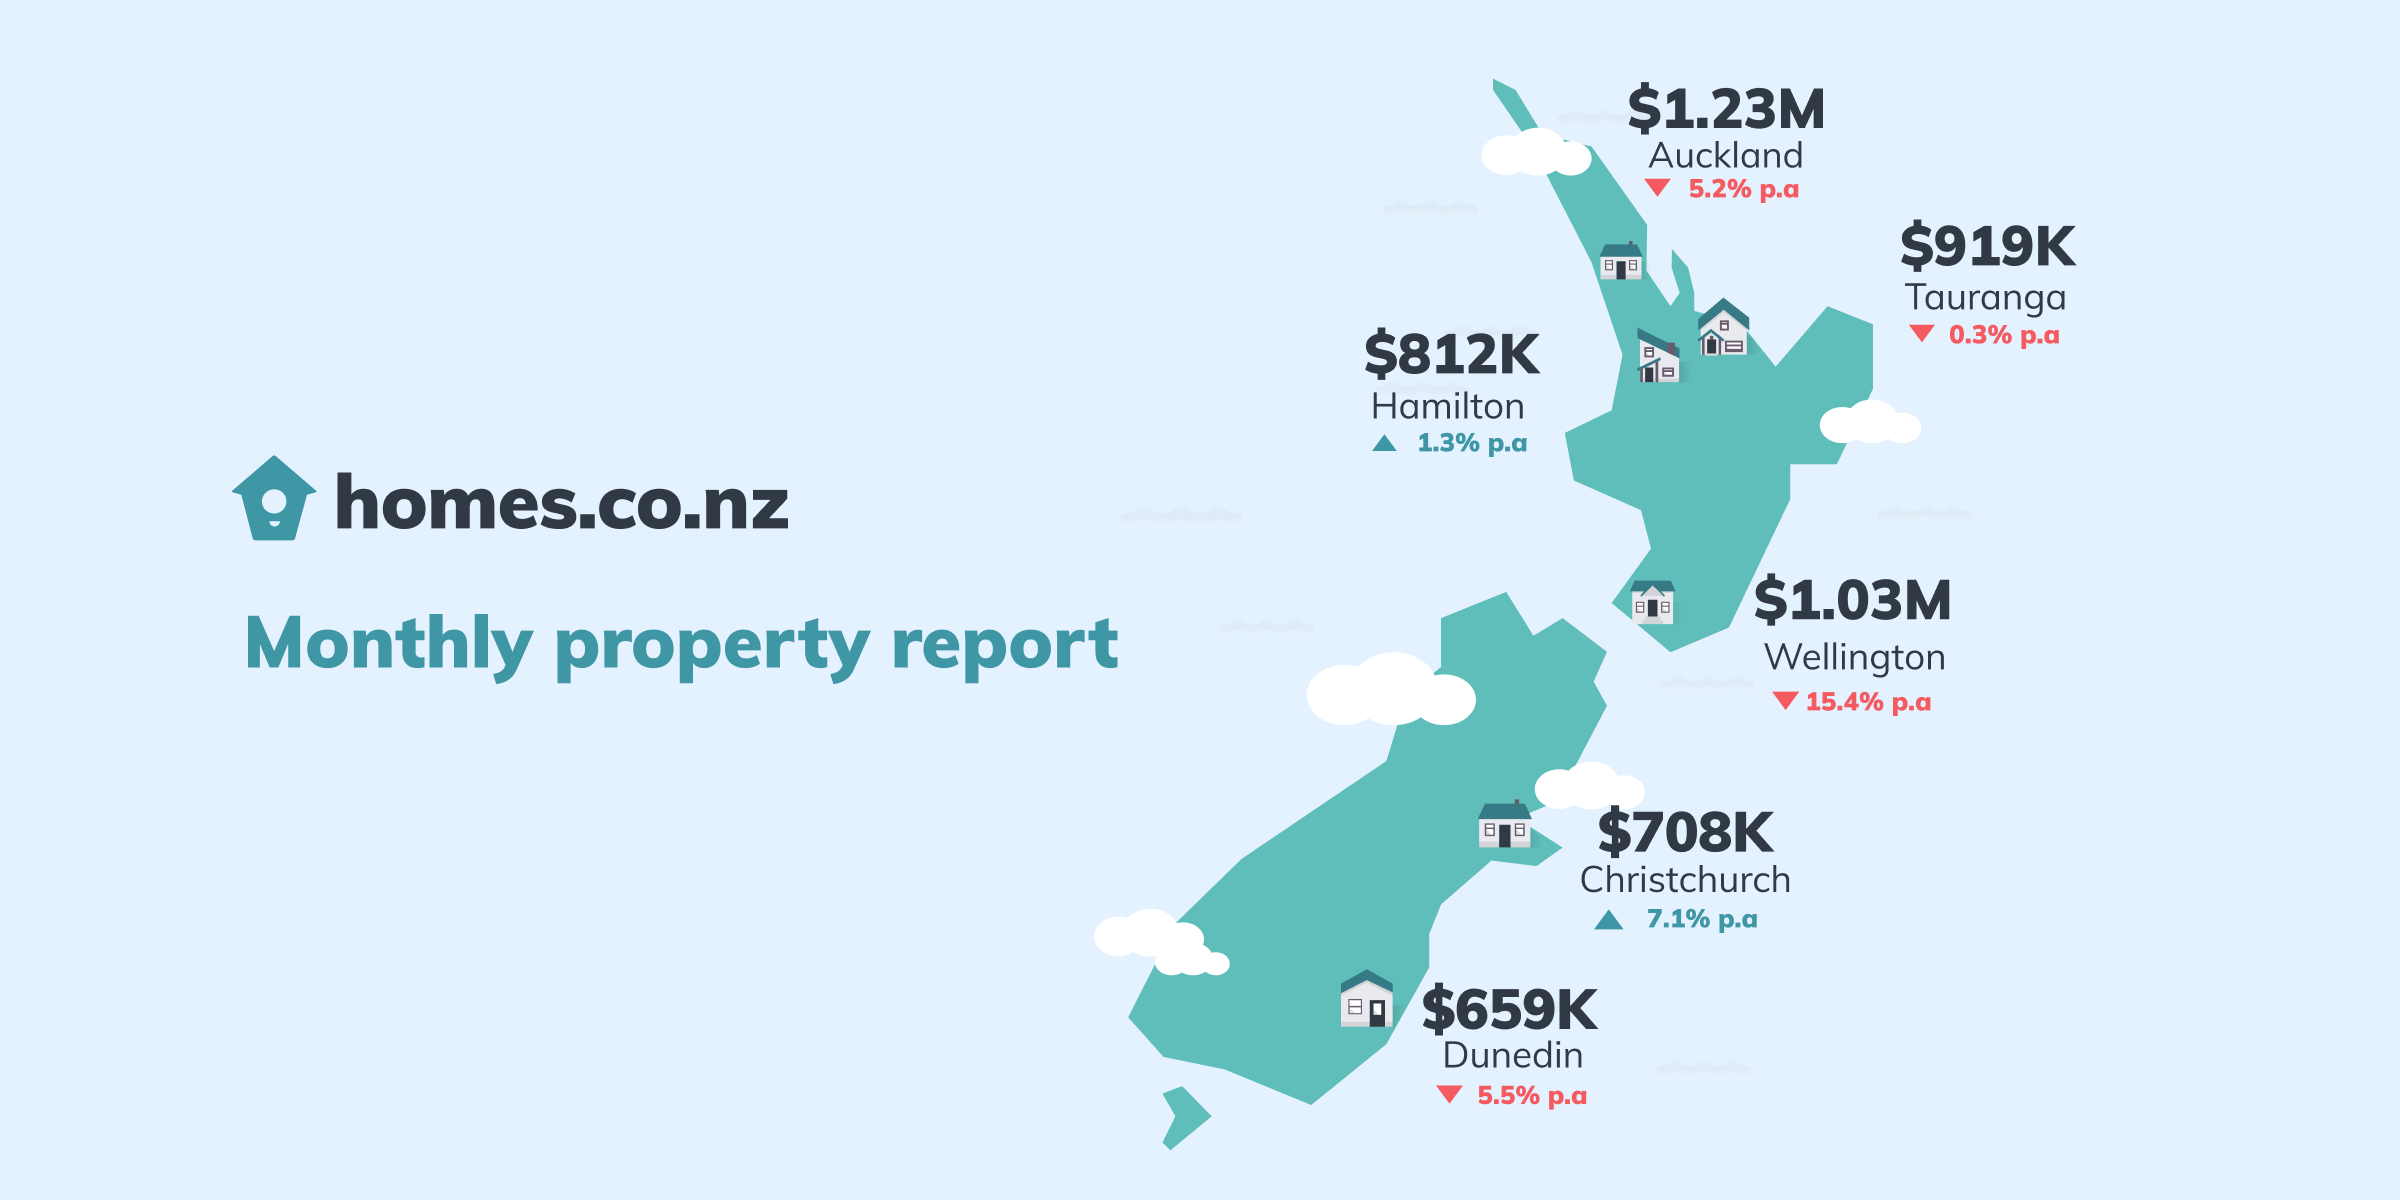
The homes.co.nz Monthly Property Update is generated using homes.co.nz’s June 2019 HomesEstimates, providing an up-to-date perspective on house values around New Zealand.

Trends in our Main Cities
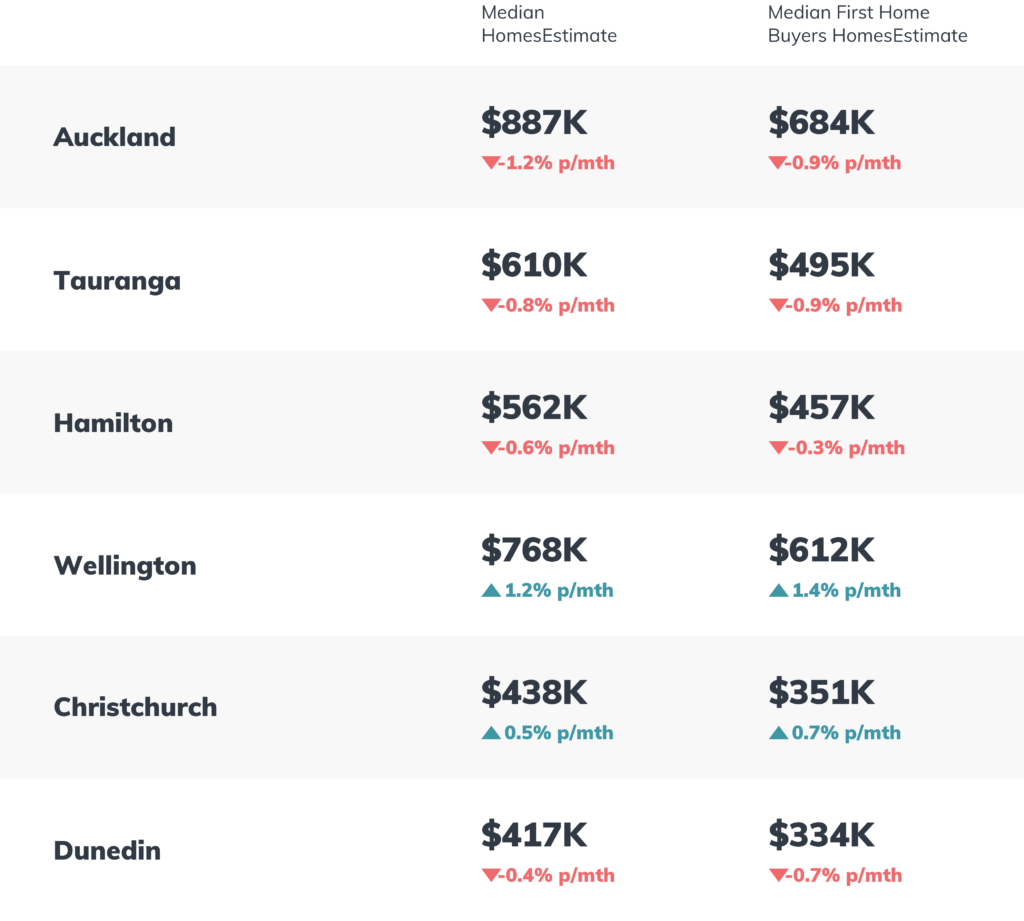
Heading into winter, we are in a holding pattern with the property market showing much of the same as previous months. The median HomesEstimate in Auckland continues to decrease slightly (down 1.2% this month), while Wellington HomesEstimates continue to rise.
Much of the rest of the country has seen small and fluctuations, but no significant changes either way. It is interesting to see the first dip in Dunedin’s growth in over a year. Is this the temporary impact of the start of the southern chill, or are Dunedin property prices reaching a peak?

NZ’s First Home Buyer HomesEstimate
The “First Home Buyer HomesEstimate” is homes.co.nz’s estimate of what a typical first home may cost. It is calculated to be the lower quartile HomesEstimate in a town.

How do we calculate these figures?
The homes.co.nz Monthly Property Update is generated using homes.co.nz’s monthly HomesEstimates and provides an up-to-date perspective on house values around New Zealand. By valuing the entire housing stock, the homes.co.nz Monthly Property Update can compare median values from month to month in a consistent and reliable way. Our HomesEstimates are calculated for almost every home in New Zealand by an algorithm that identifies the relationships between sales prices and the features of a property.
Established in 2013, homes.co.nz is NZ’s first free property information portal eager to share free property information to New Zealanders.


