Not so long ago, ‘millionaires’ were few and far between. Now, here in 2022, it’s a concept common among the middle class – and it’s causing a growing divide.
Dot Loves Data used homes.co.nz figures to analyse the sales price estimate of 1.64m New Zealand homes. Of these, 800,000 were shown to be worth over $1m, putting almost half of New Zealand homeowners squarely in the millionaire category. Conversely, for many Kiwis, the prospect of home ownership is even more out of reach.
We are seeing an impact on the intergenerational wealth divide, explainsDot Loves Data’s Director Dr Tamsyn Hilder. “Incomes have increased, but not as fast as home prices. This means many people are stuck renting or have to move somewhere more affordable if they want to buy a home. In one sense, we have a middle class made rich by rising property wealth, while renting families are struggling to afford the internet and basic household bills.”
So, what’s the solution?
While there is some reprieve on the horizon – homes.co.nz’s HomesEstimate report this month shows the growth of house prices to be slowing – it’s unlikely to go far enough.
Today, the average house price is more than 8 times the average income, compared with 4 times in 1990. This shift in affordability has led many to rely on he Bank of Mum and Dad, which is now the fifth largest lender behind ANZ, ASB, Westpac and BNZ.
Dr Hilder from Dot Loves Data says: “Put simply, if you don’t inherit a home or funds from the Bank of Mum and Dad, you won’t own your own property, no matter how hard you work and save. We’ve calculated that the average Auckland earner would need to save for 17 years for a 20% home deposit, let alone paying off their mortgage. The social divide is already a chasm.”
Dr Hilder suggests that we look abroad at measures that have been successful in curbing these inequalities. We could look to Singapore, where 78% of the population live in state housing. Japan has a centralised and permissive regulatory system that aids abundant housing, and in 2015, Germany introduced rent control measures.

Trends in our Main Cities
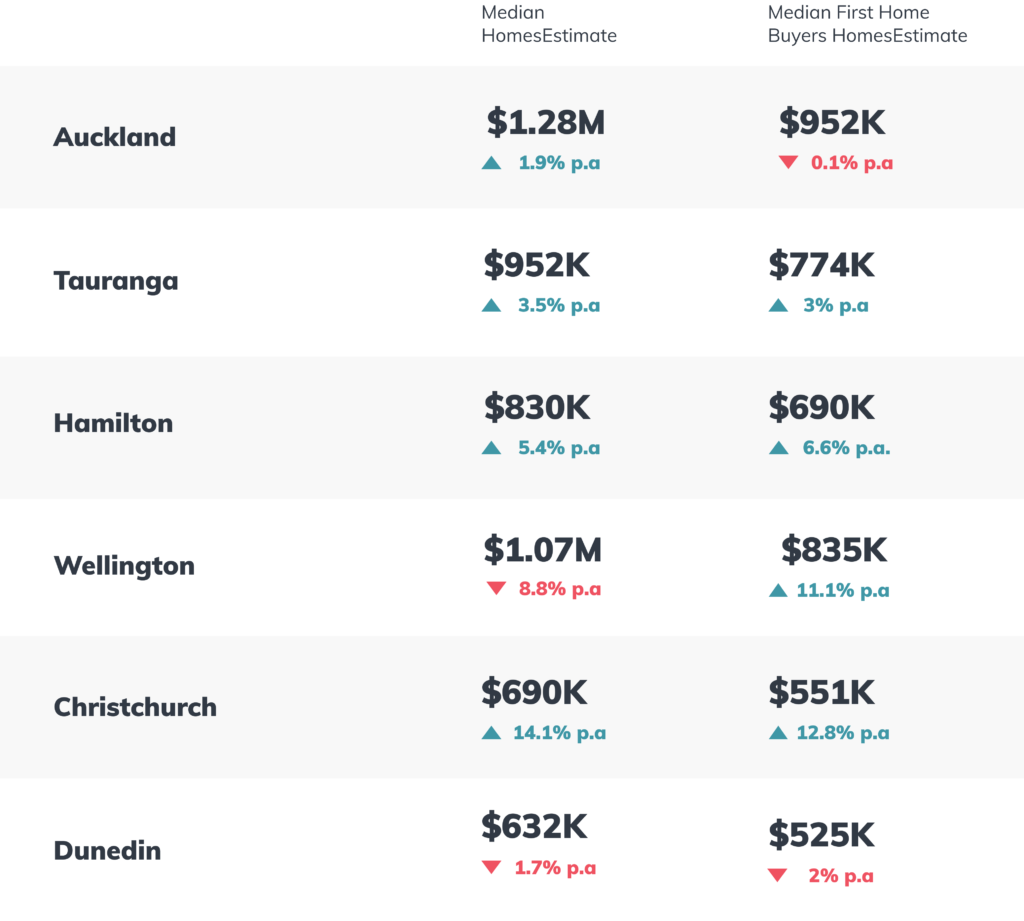
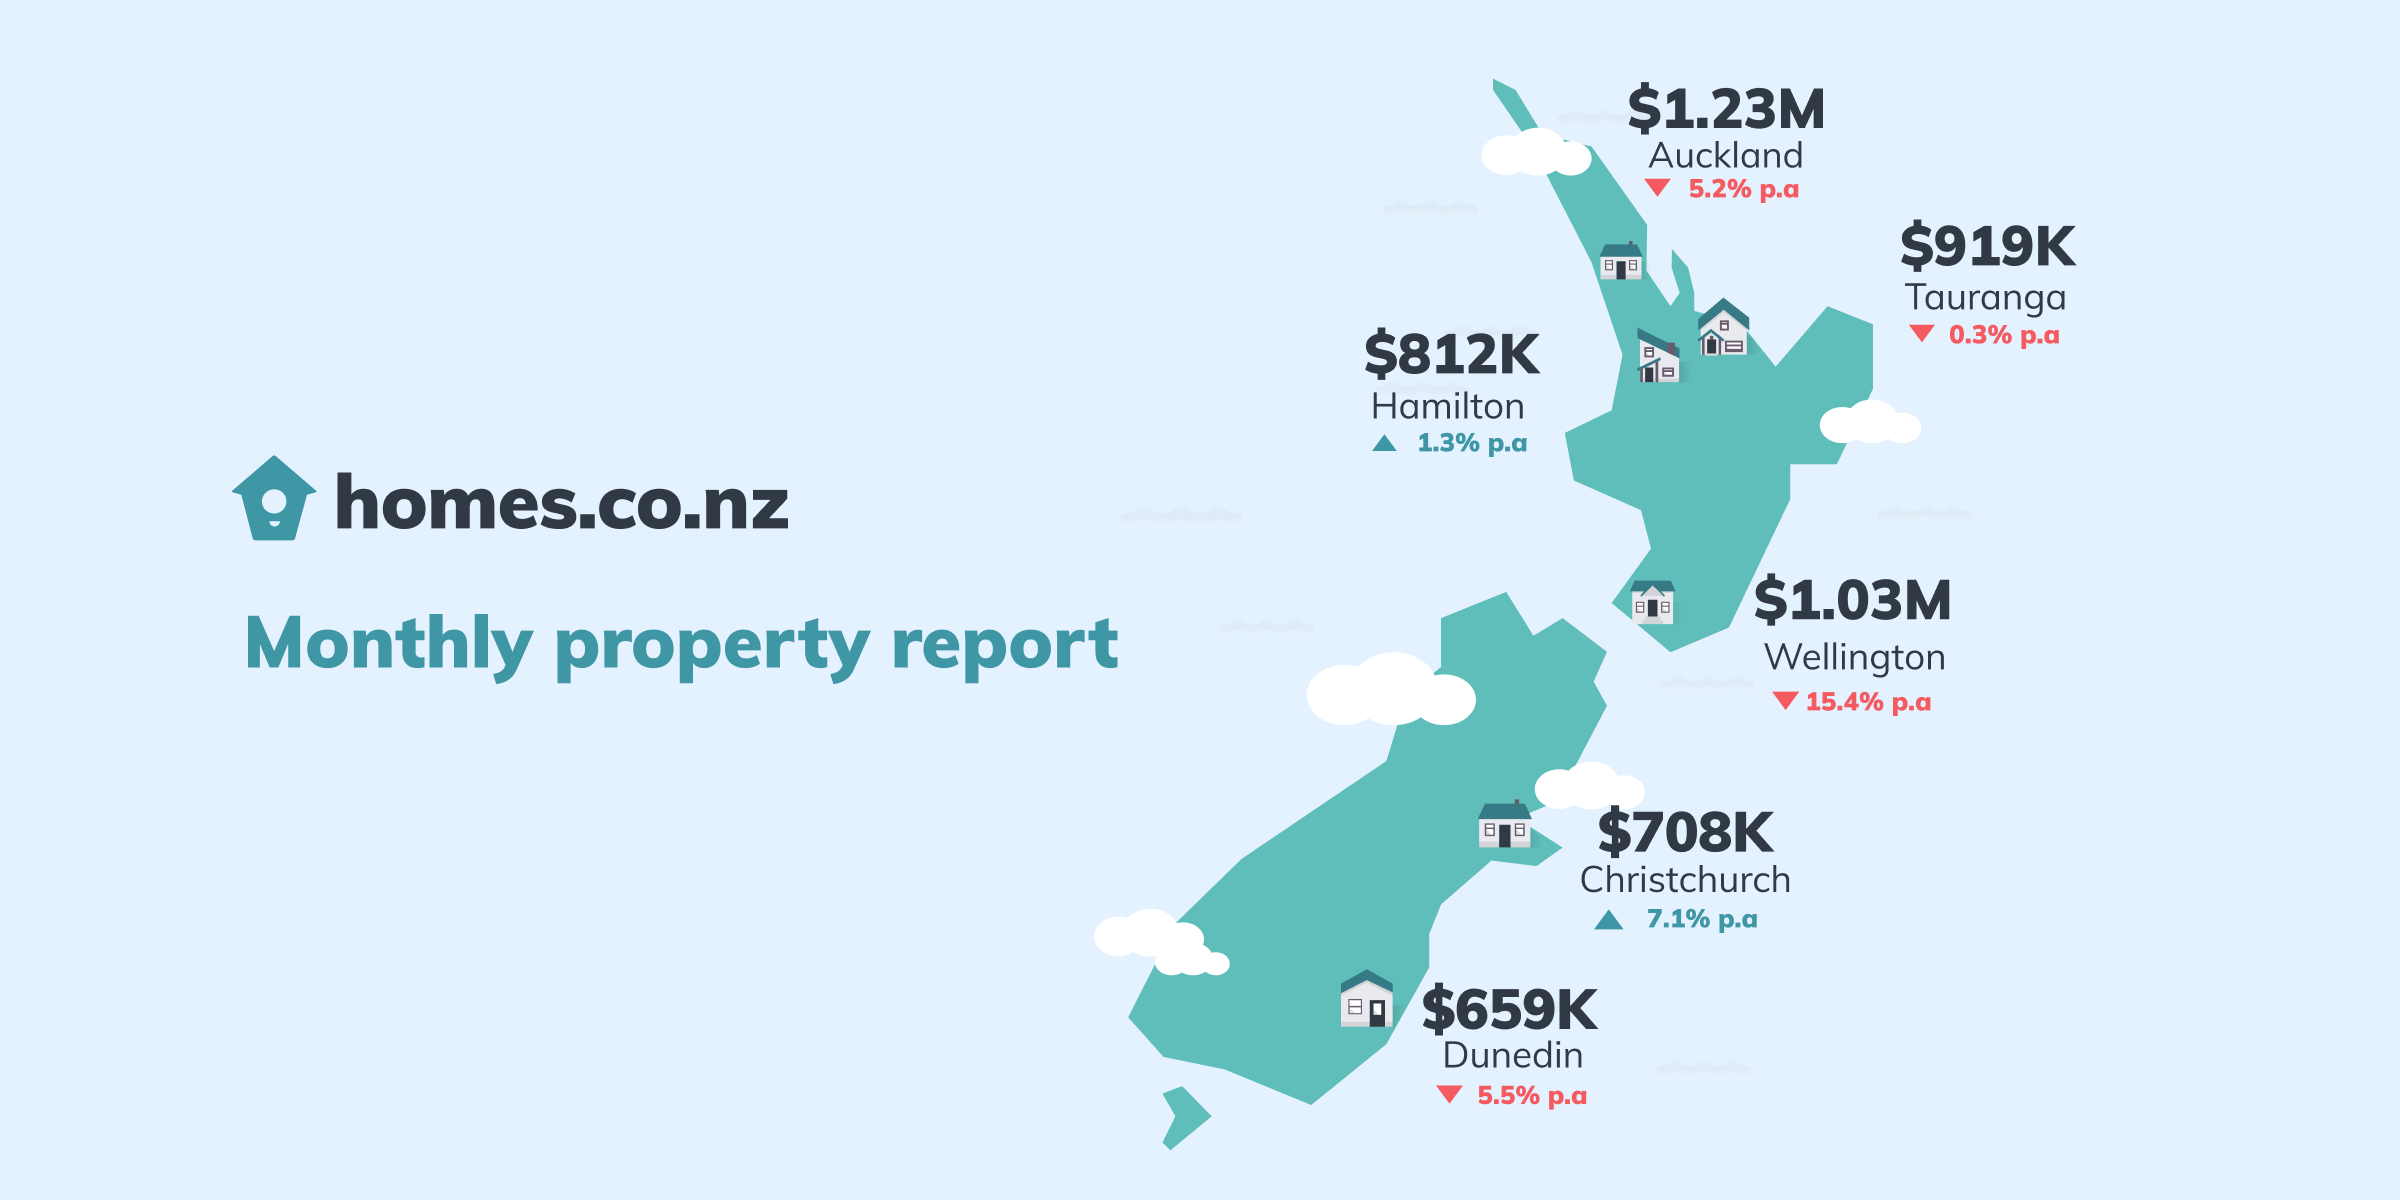
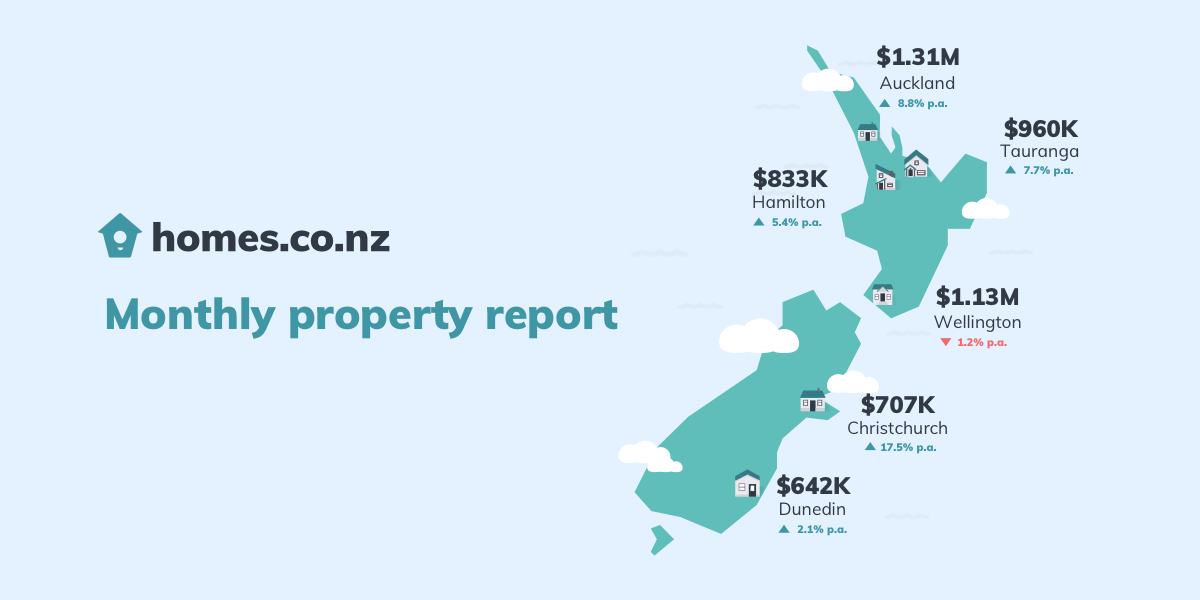
Over the last month, the median HomesEstimate has seen a downward trend across all of our main cities. Wellington has seen the most dramatic drop, falling 18.4%, since its peak in February this year. Christchurch continues steady year-on-year growth, with a 14.1% increase on the same time last year.
How do we calculate these figures?
The homes.co.nz Monthly Property Update is generated using homes.co.nz’s monthly HomesEstimates and provides an up-to-date perspective on house values around New Zealand. By valuing the entire housing stock, the homes.co.nz Monthly Property Update can compare median values from month to month in a consistent and reliable way. Our HomesEstimates are calculated for almost every home in New Zealand by an algorithm that identifies the relationships between sales prices and the features of a property.
Established in 2013, homes.co.nz is NZ’s first free property information portal eager to share free property information to New Zealanders.
NZ’s First Home Buyer HomesEstimate
The “First Home Buyer HomesEstimate” is homes.co.nz’s estimate of what a typical first home may cost. It is calculated to be the lower quartile HomesEstimate in a town.


