Well, that escalated quickly! One minute we were enjoying life in Level 1, and the next day we were in lockdown with all the challenges it posed. The team at homes.co.nz wishes everyone well during this time and fingers crossed restrictions continue to loosen in the coming weeks.
As we’ve been here before when New Zealand entered a national lockdown in March / April 2020, we thought we’d take a look at the related property trends and what we could expect this time around.
Key trends from last lockdown:
-
Interest in property didn’t stay down for long – Website visitors to homes.co.nz dropped significantly during the last national Level 4 lockdown. As kiwi’s attention was understandably elsewhere, homes.co.nz’s monthly users dropped by 25% from February to April. However, this was short-lived with monthly users increasing to record numbers again in May and continuing to increase thereafter.
- Sales volumes picked up after lockdown ended – With L4 restrictions preventing many sales from occurring, the number of sales dropped significantly in April. However, it appears that there was a significant level of pent-up demand with sales volumes increasing sharply thereafter, even throughout the usually quiet winter months. The short L3 Auckland lockdown in August caused a localised dip in sales volumes, but the overall trend going into Spring and Summer was not disrupted. We have seen a similar drop in the volume of new listings during this lockdown and can expect a similar drop in sales volumes in August 2021.
- Sales lead indicators predicting bumper spring – During the last lockdown there was a dip in listing enquiries as there was little stock available, but overall the buying demand remained high. Buying demand has continued to increase since. Before this lockdown in July and August, homes.co.nz was seeing record numbers of appraisal requests indicating a strong selling season ahead.
What can we expect after this lockdown?
There are a few of the key differences in this lockdown compared to last time NZ went into Level 4:
- Seasonality – The last lockdown occurred in late summer/autumn at the end of the typical selling season, while this lockdown is occurring heading into spring when more people are getting ready to sell.
- Economic conditions – The last lockdown occurred during a period of decreasing interest rates and triggered a number of interventions to keep the property market moving. The current conditions are the opposite with interest rates increasing and measures being introduced to cool the housing market.
Another interesting trend is there appears to be more interest in the regions with more Aucklanders researching property outside of the city. We measured the percentage of homes.co.nz users in Auckland who were also researching properties in other areas. This analysis was then done at three different 10-day intervals:
- Last 10 days (current lockdown): 24.9% of Auckland users were also researching in other areas
- 10 day period approx. 3 months ago (at the height of the market): 8.4% of Auckland users were also researching in other areas
- 10 days in August 2020 when Auckland was in a Level 3 lockdown: Only 3.6% of Auckland users were also researching in other areas
There are likely a number of factors contributing to Aucklanders showing more of an interest in the regions including the higher risk of COVID and lockdowns, more flexibility to work remotely and high prices driving people away. With Auckland being closer to the top of the market, many homeowners may also be considering using their capital gains to invest in other areas where prices are still increasing.
So what can we expect? Assuming the current lockdown is relatively short, we can expect a spike in new listings going into Spring as those showing selling intent take action and strong demand in regional areas as some consider a move out of Auckland. However, it would seem unlikely that we’ll see the same price growth out the back of this lockdown, but would more likely see a new and more subdued trend emerge.
Monthly Property Update
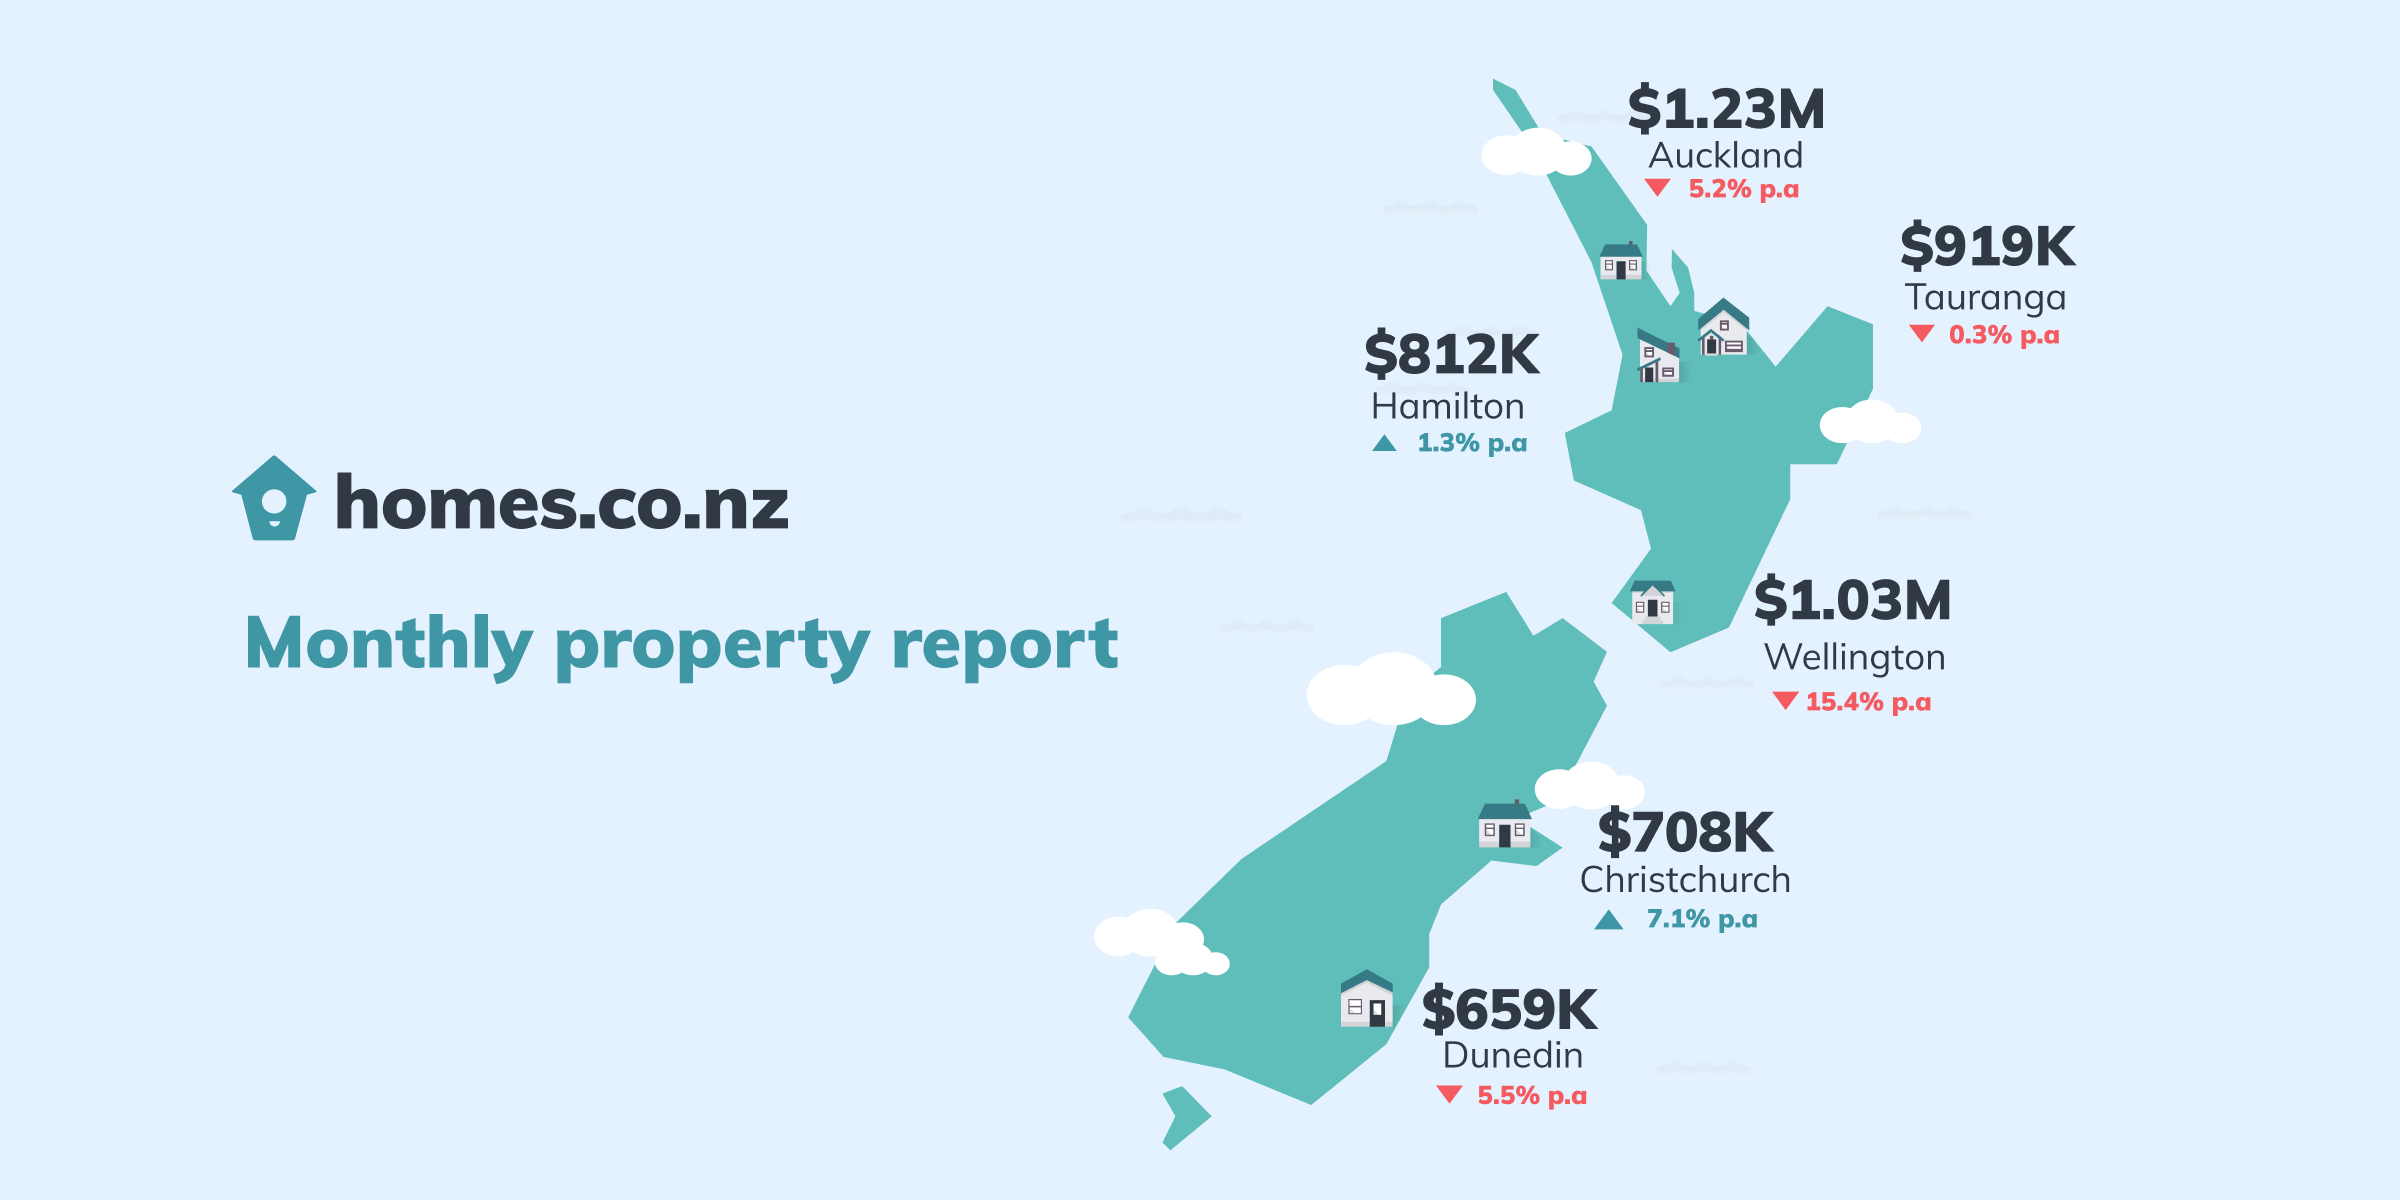
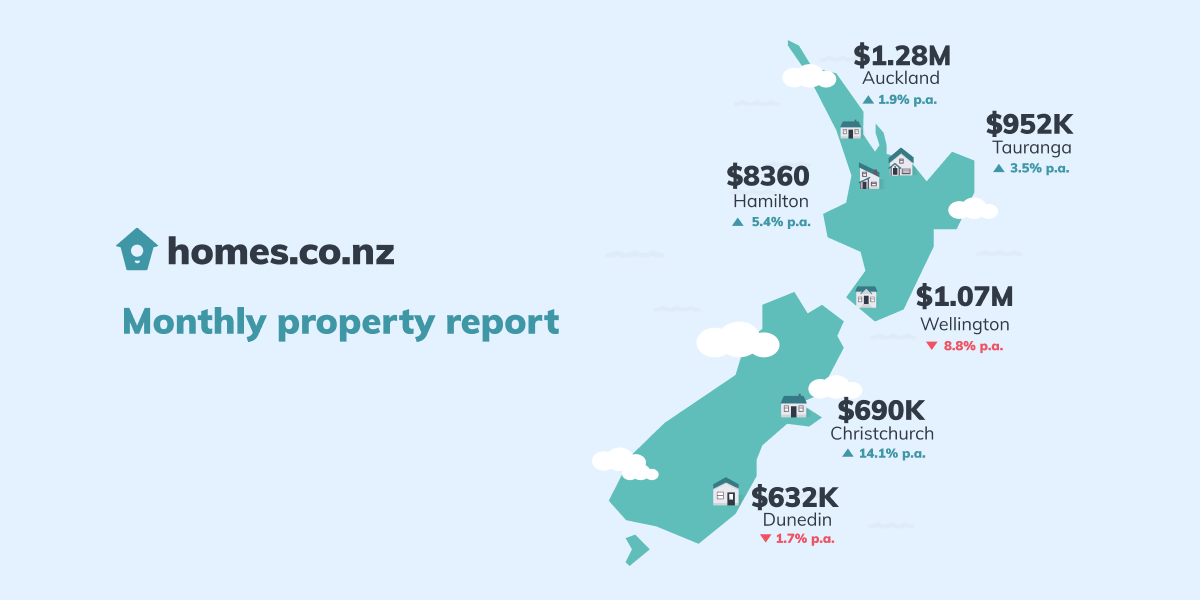
The homes.co.nz Monthly Property Update is generated using homes.co.nz’s September 2021 HomesEstimates, providing an up-to-date perspective on house values around New Zealand.
Trends in our Main Cities
See the median HomesEstimate across New Zealand’s main centres below.
NZ’s First Home Buyer HomesEstimate
The “First Home Buyer HomesEstimate” is homes.co.nz’s estimate of what a typical first home may cost. It is calculated to be the lower quartile HomesEstimate in a town.
How do we calculate these figures?
The homes.co.nz Monthly Property Update is generated using homes.co.nz’s monthly HomesEstimates and provides an up-to-date perspective on house values around New Zealand. By valuing the entire housing stock, the homes.co.nz Monthly Property Update can compare median values from month to month in a consistent and reliable way. Our HomesEstimates are calculated for almost every home in New Zealand by an algorithm that identifies the relationships between sales prices and the features of a property.


